The composition of the European Parliament
This image shows the distribution of the MEPs in the European Parliament.
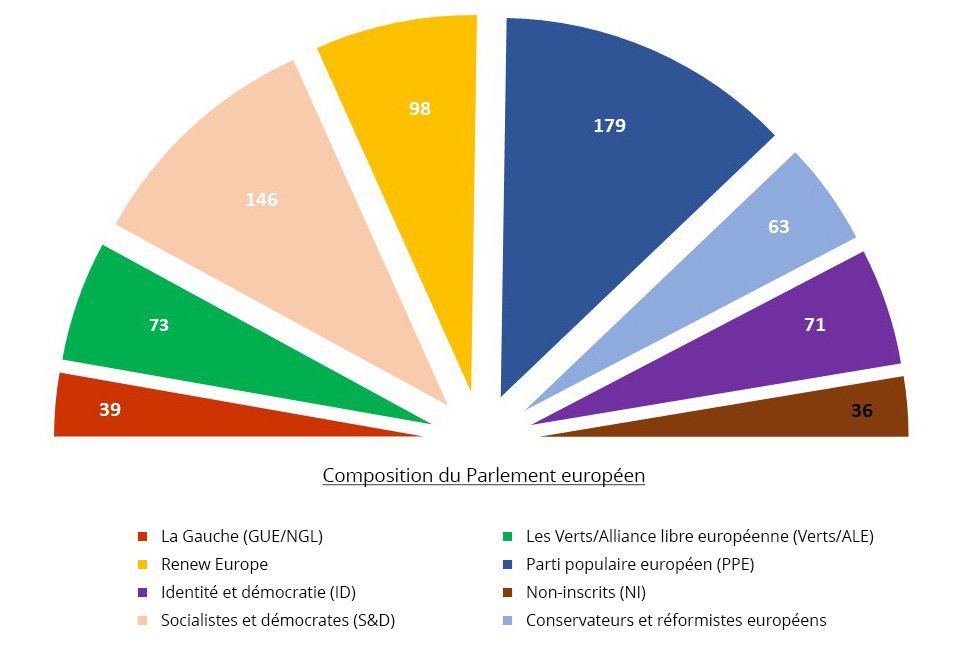
Source : European Parliament
This image shows the distribution of the MEPs in the European Parliament.
Source : European Parliament
| European Peoples Party (EPP) | Progressive Alliance of Socialists and Democrats (S&D) | Renew Europe | Greens–European Free Alliance (Greens/EFA) | Identity and Democracy (ID) | European Conservatives and Reformists (ECR) | The Left in the European Parliament (GUE/NGL) | Non-attached | TOTAL | ||
|---|---|---|---|---|---|---|---|---|---|---|
| 4 | 2 | 4 | 3 | 3 | 3 | 1 | 1 | 21 | ||
| 7 | 5 | 3 | 0 | 0 | 2 | 0 | 0 | 17 | ||
| 5 | 1 | 5 | 3 | 2 | 4 | 1 | 0 | 21 | ||
| 1 | 3 | 6 | 2 | 1 | 0 | 1 | 0 | 14 | ||
| 30 | 16 | 7 | 25 | 9 | 1 | 5 | 3 | 96 | ||
| 1 | 2 | 3 | 0 | 1 | 0 | 0 | 0 | 7 | ||
| 5 | 0 | 2 | 2 | 0 | 0 | 4 | 0 | 13 | ||
| 7 | 1 | 1 | 0 | 0 | 1 | 5 | 6 | 21 | ||
| 13 | 21 | 9 | 4 | 0 | 4 | 5 | 3 | 59 | ||
| 8 | 7 | 23 | 12 | 18 | 0 | 6 | 5 | 79 | ||
| 4 | 4 | 1 | 0 | 0 | 1 | 0 | 2 | 12 | ||
| 11 | 16 | 3 | 3 | 24 | 9 | 0 | 10 | 75 | ||
| 2 | 2 | 0 | 0 | 0 | 0 | 2 | 0 | 6 | ||
| 3 | 2 | 1 | 0 | 0 | 1 | 0 | 1 | 8 | ||
| 4 | 2 | 1 | 2 | 0 | 1 | 0 | 1 | 11 | ||
| 2 | 1 | 2 | 1 | 0 | 0 | 0 | 0 | 6 | ||
| 1 | 5 | 2 | 0 | 0 | 0 | 0 | 13 | 21 | ||
| 2 | 4 | 0 | 0 | 0 | 0 | 0 | 0 | 6 | ||
| 6 | 6 | 7 | 3 | 0 | 5 | 1 | 1 | 29 | ||
| 7 | 5 | 1 | 3 | 3 | 0 | 0 | 0 | 19 | ||
| 16 | 7 | 1 | 1 | 0 | 27 | 0 | 0 | 52 | ||
| 7 | 9 | 0 | 1 | 0 | 0 | 4 | 0 | 21 | ||
| 14 | 10 | 7 | 1 | 0 | 1 | 0 | 0 | 33 | ||
| 4 | 2 | 2 | 0 | 0 | 0 | 0 | 0 | 8 | ||
| 4 | 1 | 4 | 0 | 0 | 1 | 0 | 4 | 14 | ||
| 3 | 2 | 3 | 3 | 0 | 2 | 1 | 0 | 14 | ||
| 6 | 5 | 3 | 3 | 0 | 3 | 1 | 0 | 21 | ||
| Total | 177 | 143 | 101 | 72 | 60 | 66 | 37 | 49 | 705 |
| Etat membre | % |
|---|---|
| 66,67 | |
| 57,14 | |
| 52,38 | |
| 50 | |
| 50 | |
| 48,28 | |
| 48,1 | |
| 47,62 | |
| 46,05 | |
| 42,86 | |
| 38,46 | |
| 38,10 | |
| 38,10 | |
| 37,5 | |
| 36,84 | |
| 36,46 | |
| 35,29 | |
| 33,33 | |
| 33,33 | |
| 33,33 | |
| 29,41 | |
| 28,57 | |
| 28,57 | |
| 27,27 | |
| 23,81 | |
| 16,67 | |
| 15,15 | |
| EU Average | 38,49 |